Urban Traffic Monitoring and Disruption Detection During Extreme Events
Methods for detecting traffic disruptions across a city during extreme events and identifying the most affected areas, even when traffic data are incomplete.
The problem
Extreme events such as hurricanes can severely disrupt traffic across large parts of a city. Congestion spreads along connected roads, so a disruption in one area can quickly create bottlenecks elsewhere. Its severity and timing can also vary widely from one neighborhood to the next.
During these events, emergency managers and traffic operators need quick answers to two questions: Is the transportation network as a whole disrupted? Where are the disruptions most severe? These answers guide emergency response, traffic management, and access to essential services.
Existing methods typically address only one of these questions. Approaches that monitor individual roads can generate excessive false alarms across a citywide network and miss broader disruption patterns. Network-wide methods can detect widespread anomalies but often cannot pinpoint the areas most affected. Both face additional challenges when traffic observations are missing, a common problem during extreme events.
The goal: a monitoring system that detects network-wide disruptions, pinpoints the affected areas, and remains reliable even when traffic data are incomplete.
Data
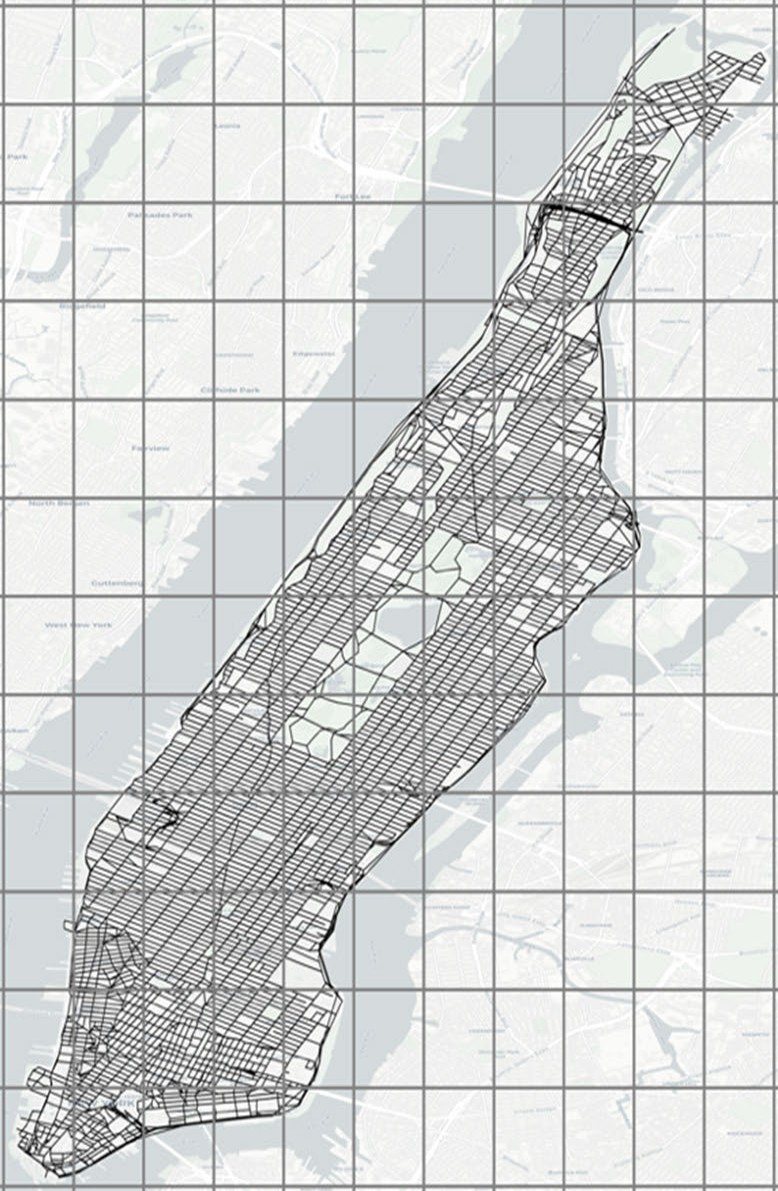
Taxi trips were converted into hourly travel times on Manhattan’s road network. Neighboring road segments were then grouped into small zones of similar size so that each zone has enough data to describe its local traffic, measured as the zone’s average travel pace. The data span both normal conditions and extreme events, including Hurricane Sandy.
Approach
Two successive methods are proposed. The first captures the relationships between traffic zones to detect disruptions at both the network and zone levels. The second extends this framework with deep learning and integrated missing-data imputation.
1. Temporal self-expressive model
Traffic conditions in different zones are interconnected. Rather than monitoring each zone independently, this method represents the traffic in each zone as a sparse combination of traffic in other zones. The resulting model captures the network’s normal traffic relationships and is solved efficiently in parallel using ADMM.
A statistical control chart monitors how well these relationships explain the observed traffic over time. A significant deterioration in model fit signals a network-wide disruption, and zone-level anomaly scores identify the areas that deviate most from their expected patterns.
2. SI-DMSeq: a self-imputing deep multitask sequence model
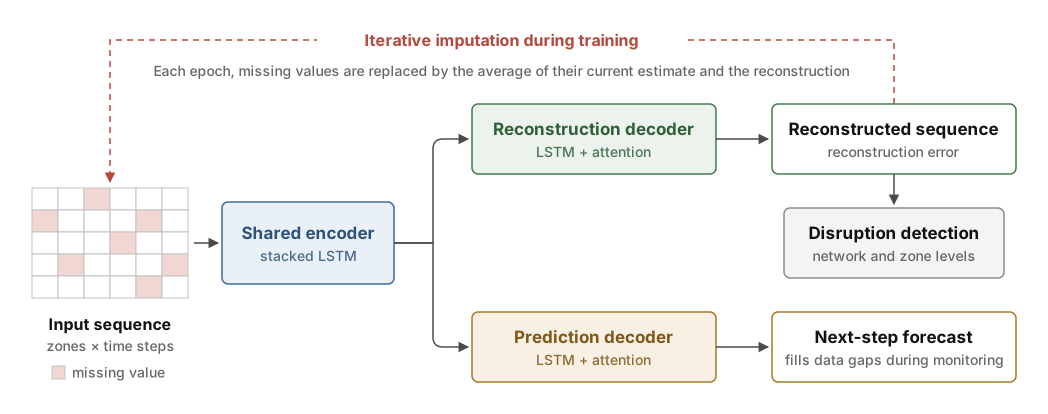
The second method extends dual-level monitoring to incomplete traffic data. SI-DMSeq uses a shared LSTM encoder and two attention-based decoders to learn normal traffic patterns through two complementary tasks:
- Reconstruction: an autoencoder-style decoder reconstructs the input traffic sequence, and reconstruction errors are used to detect disruptions at both the network and zone levels.
- Prediction and imputation: a second decoder predicts traffic conditions at the next time step and estimates missing values, allowing monitoring to continue despite data gaps.
An iterative self-imputation strategy enables the model to train on incomplete sequences. By learning both tasks jointly, SI-DMSeq integrates disruption detection and missing-data imputation within a single model.
Results
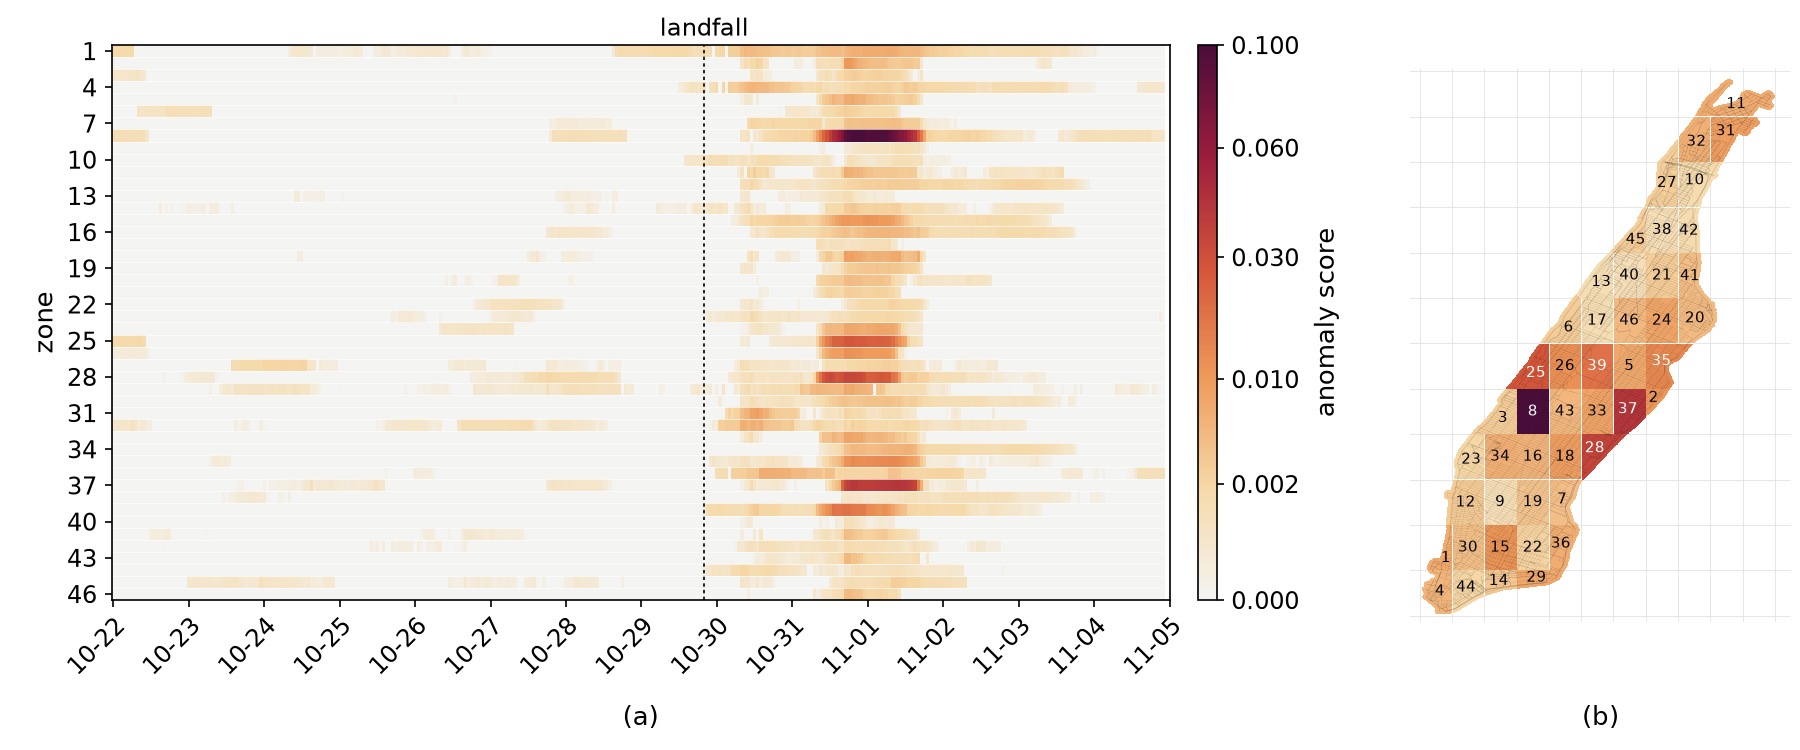
- Network-wide detection. Hurricane Sandy’s citywide disruption was detected shortly after landfall and persisted until the morning of November 2, while traffic in the week before the storm remained within normal limits.
- Localized disruption. Zone-level scores showed that Midtown was the most affected area, especially around Times Square and along the East Side, while Morningside Heights and Harlem were the least affected.
- Robust to missing data. Network- and zone-level detection were combined with missing-data imputation in a single model, so monitoring keeps working when traffic data are incomplete.
The top image shows zone-level anomaly scores around Hurricane Sandy, with each zone’s peak score on the map (b).
Methods & tools
Temporal self-expressive modeling · sparse optimization · ADMM · statistical process control · attention-based sequence learning · multitask learning · autoencoders · missing-data imputation · Python · PyTorch
This research was supported by the U.S. National Science Foundation under Grant No. CMMI-2026795.